Today - 07 July 2025
Now - 19:05:11
Now - 19:05:11
Regression analysis is a statistical research method that allows to show the dependence of a parameter from one or several independent variables. In the pre-computer era it was quite difficult, especially if it was about large amounts of data. Today, learning how to build a regression in Excel to solve difficult statistical problems in just a few minutes. Below are specific examples from the field of economy.
This concept was introduced to mathematics by Francis Galton in 1886. Regression byvaet:
Consider the problem of determining the dependence of the number of retired members of staff of the average salary in 6 industrial enterprises.
The Task. In the six enterprises analyzed the average monthly wages and number of employees who resigned at their own request. In tabular form we have:
TheA | B | C | |
1 | X | Resigned | Salary |
2 | Y | 30000 rubles | |
3 | 1 | 60 | 35,000 rubles |
4 | 2 | 35 | 40,000 rubles |
5 | 3 | 20 | 45,000 rubles |
6 | 4 | 20 | 50000 RUR |
7 | 5 | 15 | 55000 rubles |
8 | 6 | 15 | 60,000 rubles |
For the purpose of determining the dependence of the number of dismissed workers of the average wage for 6 plants regression model has the form equation Y = a0 + a1X1 +…+aKXK where xI — influencing variables, aI — the regression coefficients, a k — the number of factors.
For this task, Y is the index of retired employees, and the influencing factor — the salary, which is denoted by X.
The regression Analysis in Excel must be preceded by application to the existing tabular data built-in functions. However for these purposes it is better to use a very useful add-in "analysis ToolPak". To activate it:
Recommended

How to get out of "Skype" on the "Android" and not only
How to get out of "Skype" "Android"? This question bothers many users. The thing is that the messenger is not so difficult. But there are features that are only for mobile versions. To log out of Skype in this case more difficult than it seems. But i...

Kingo ROOT: how to use the program to gain administrative rights on Android
The Gadgets on the platform Android regained the lion's share of the market. Developers are continually perfecting the OS, trying to fit the needs of the users, but from year to year admit palpable mistake: forbid the owner to "stuffing" of his gadge...

How to get from Stormwind to Tanaris: practical tips
World of Warcraft is an iconic MMORPG, uniting millions of players around the world. There are many locations and puzzles, secret trails and larger, but rather dangerous paths. Sooner or later, every player chose the side of the Alliance, we have to ...
If done correctly, in the right part of the tab “Data”, located above the worksheet “Excel”, will be the right button.
Now that you have all the necessary virtual tools to carry out econometric analysis can proceed to the solution of our problem. To do this:
The program will automatically populate a new worksheet spreadsheet data regression analysis. Please note! In Excel there is an opportunity to set the location that you prefer for this purpose. For example, it may be the same sheet where the values of Y and X, or even a new book specifically designed for the storage of such data.
In Excel, the data obtained in the course of processing the example have the following form:
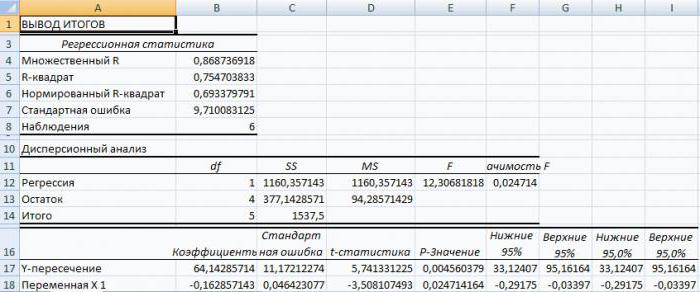
First of all, you should pay attention to the value of R-square. It represents the coefficient of determination. In this example, R-squared = 0,755 (75,5%), i.e. the estimated parameters of the model to explain the dependence between the considered parameters by 75.5 %. The higher the value of coefficient of determination, the selected model is considered more applicable for a specific task. It is believed that it correctly describes the real situation when the value of R-squared above 0.8. If R-squared<0.5, then such a regression analysis in Excel cannot be considered reasonable.
The Number 64,1428 shows what will be the value of Y when all xi variables in this model are cleared. In other words, it can be argued that the value of the analyzed parameter is influenced by other factors not described in a specific pattern.
The Following coefficients -0,16285 located in cell B18, shows the weight of influence of variable X on Y. This means that the average monthly salary of employees within the limits of the model affects the number retired with the weight -0,16285, i.e. the degree of itsthe impact is quite small. Mark “-” indicates that the coefficient has a negative value. This is obvious because we all know that the higher the salary at the enterprise, the less people Express a desire to terminate an employment contract or retires.
The term refers to the equation of several independent variables of the form:
Y=f(x1+x2+…, xM) + ε, where y is the resultant characteristic (the dependent variable) and x1, x2, …, xM — the signs of the factors (independent variables).
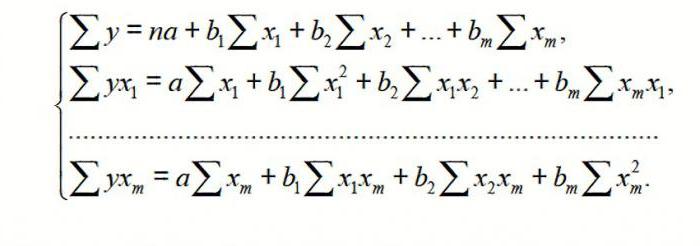
For multiple regression (Mr) it is carried out using the least squares method (OLS). For linear equations of the form Y = a + b1X1 +…+bMXM+ ε build the system of normal equations (see below)
To understand the principle of the method, consider the two-factor case. Then we have the situation described by the formula
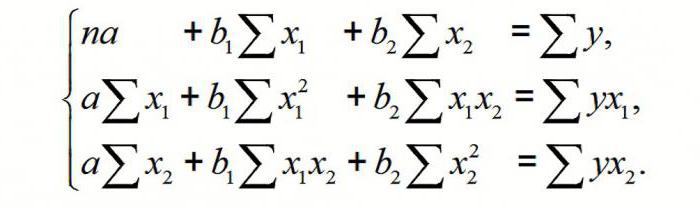
This yields:
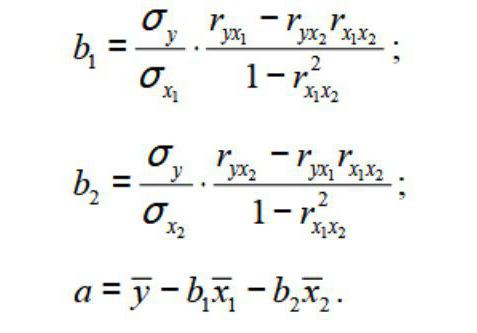
Where σ — this variance of the respective symptom, as reflected in the index.
OLS applied to the equation of Mr in standardizarea scale. In this case, we obtain the equation:
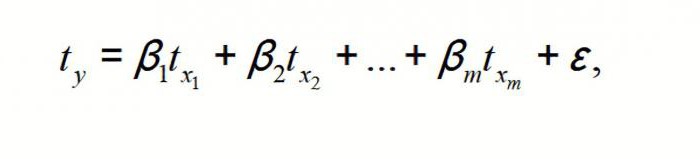
In which tY, tX1, …TXm — Standartiniame variables for which mean values are equal to 0; a βI — the standardized regression coefficients, standard deviations — 1.
Please note that all of the βI In this case, is set as a normalized and centralisima, so the comparison between them is considered correct and acceptable. In addition, it is common to carry out screening factors, discarding those that have the lowest values of βi.
Suppose you have a table of dynamics of prices of a particular product N during the last 8 months. Need to make a decision on whether to buy his party at a price of 1850 rubles/T.
A | B | C | |
1 | Number of months | Month name | Price of item N |
2 | 1 | January | 1750 rubles per ton |
3 | 2 | February | 1755 roubles per tonne |
4 | 3 | March | 1767 rubles per ton |
5 | 4 | APR | 1760 rubles per ton |
6 | 5 | May | 1770 rubles per ton |
7 | 6 | June | 1790 rubles per ton |
8 | 7 | July | 1810 rubles per ton |
9 | 8 | August | 1840 rubles per ton |
To solve this problem in a spreadsheet “Excel”, you need to use already known by the above example, the "data Analysis". Next, choose the section called "Regression" and set the parameters. You need to remember that the “Input Y interval” there must be a range of values for the dependent variable (in this case, the price of the product in specific months), and in «Input the interval X” — the independent (number of month). Confirm the action by pressing “Ok”. On a new worksheet (if so specified) data obtained for regression.
We Build on them the linear equation of the form y=ax+b, where parameters a and b are the coefficients of the row with the name of the month as a number and the odds and line “Y-the intersection” of the sheet with the results of the regression analysis. Thus, the linear equation of regression (SD) for problem 3 is written in the form:
The Price of goods N = 11,714* the number of the month + 1727,54.
Or algebraic notation
Y = 11,714 x + 1727,54
To address adequately whether the obtained equations of linear regression, coefficients of multiple correlation (CMC) and determination, as well as the Fisher test and student test. The table “Excel” with the results of the regression, they are called multiple R, R square, F-statistics and t-statistics respectively.
KMK R gives the possibility to evaluate the tightness of the probabilistic relationship between independent and dependent variables. Its high value indicates a fairly strong relationship between the variables “the month” and “the Price of product N in roubles for 1 ton”. However, the nature of this relationship remains unknown.
The square of the coefficient of determination R2(RI) is a numerical characteristic of the portion of the total variation and shows some scatter of the experimental data, i.e. the values of the dependentthe variable corresponds to the linear regression equation. In the present task, this value is equal to 84,8%, i.e. statistical data with a high degree of accuracy describes the received UR.
The F-statistic, also called the Fisher criterion is used to assess the significance of linear dependence, refuting or confirming the hypothesis about its existence.
The Value of t-statistics (student's t-test) helps to estimate the coecient of the unknown or free member linear dependence. If the value of t-test > tCu, then the hypothesis of insignificance of the intercept of a linear equation is rejected.
The problem In question to the free member through the tools “Excel”, it was found that t=169,20903, and p=2,89 E-12, i.e., have a zero probability that will be rejected true hypothesis of insignificance of the intercept. For the coecient of the unknown t=5,79405, and p=0,001158. In other words, the probability that true will be rejected the hypothesis of insignificance of the coefficient at unknown, 0.12%.
Thus, it can be argued that the obtained linear regression equation adequately.
Multiple regression in Excel is done using the same tool ‘data Analysis". Consider a specific applied task.
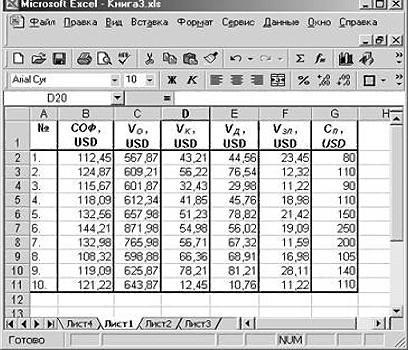
The company “NNN" must decide whether to buy 20 % stake in JSC «MMM». Value pack (SP) is 70 million us dollars. Experts “NNN" collected data about similar transactions. It was decided to assess the value of the shares on such parameters, expressed in millions of U.S. dollars:
In addition, the parameter indebtedness of the company under the salary (V3 P) in thousands of U.S. dollars.
First of all, you need to make the source data table. It has the following form:
Next:
Mark the entry for “a New worksheet" and press “Ok”.
Get the regression analysis for this task.
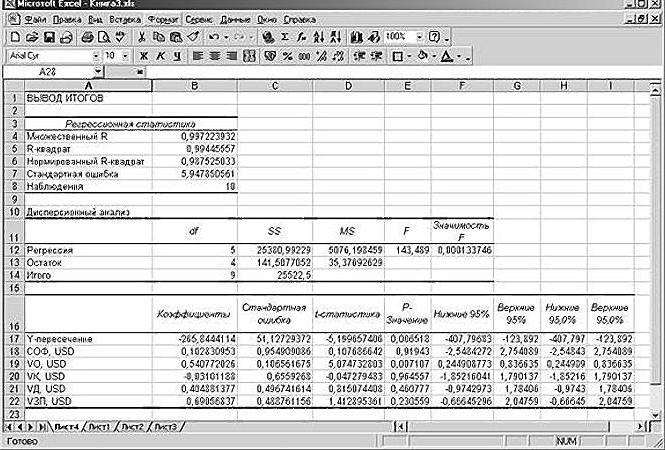
“Collect” from the rounded data presented above on the sheet spreadsheet Excel, the regression equation is:
SP = the 0.103*SOF + 0,541*VO – 0,031*VK +0,405*VD +0,691*VZP-265,844.
In a more familiar mathematical form it can be written as:
Y = the 0.103*x1 + 0,541*x2 – 0,031*x3 +0,405*x4 +0,691*x5 – 265,844
The Data for JSC «MMM» presented in the table:
SOPH, USD | VO, USD | VK, USD | VD, USD | VZP, USD | SP, USD |
102,5 | 535,5 | 45,2 | 41,5 | 21,55 | Of 64.72 |
Substituting them into the equation, get a number 64.72 million us dollars. This means that the shares of JSC «MMM» do not buy, because they cost 70 million us dollars rather overpriced.
As you can see, the use of spreadsheet “Excel” and regression equations allowed us to make an informed decision on whether it is a specific deal.
Now you know what a regression is. The examples in Excel, discussed above, will help you in the solution of practical problems from the field of econometrics.
Article in other languages:
AR: https://tostpost.com/ar/computers/1904-excel.html

Alin Trodden - author of the article, editor
"Hi, I'm Alin Trodden. I write texts, read books, and look for impressions. And I'm not bad at telling you about it. I am always happy to participate in interesting projects."
Related News
How to remove the NVIDIA driver from the system entirely
it is believed that the driver NVIDIA to remove the no need. For example, when upgrading from old versions replaced by new ones automatically. However, despite this approach, in some cases, there are failures with updates, or syst...

Creating a disk image - save what we treasure
the Main reason why you may want to create a disk image – is to reinstall the operating system. The network runs many assemblies, as well as images of the official distribution from which you can install any OS. Naturally, y...

A break-through for World of Tanks. How to penetrate the armor in World of Tanks
"world of Tanks" – a very popular game. It contains a lot of nuances and subtleties that must be understood in order to become a successful player.Why ricochetBeginners usually are not familiar with all the specifics of the ...
How to format USB drive through command prompt and what are the ways?
USB flash drives you have to format quite often, and not only for the complete purification of available information, but also to create bootable media or, in the case of file system corruption due to some malfunction. And not alw...

Declare SQL: description. Transact-SQL
Today, virtually every modern programmer knows what is Transact-SQL. This extension, which is used in SQL Server. This development is closely integrated with Microsoft SQL and adds the constructors of the programming, which initia...

How to remove double chin in Photoshop – instructions for beginners
Photoshop has received a huge application and most often, to improve a person's appearance. Today we will consider the question of how to remove double chin in “Photoshop” as it is among the most popular. For this to w...


Comments (0)
This article has no comment, be the first!